Modular Sensor Installation System
A system and mobile app designed to help service engineers install and configure modular LoRa-based sensors quickly, safely, and with minimal friction — even when strapped to a harness on top of a building.
The project combines LoRa STAR topology with Meshtastic mesh fallback, BLE onboarding via QR code, and wired recovery mode — ensuring connectivity in environments where Wi-Fi or cellular links are unreliable.
Intro & Context
The Modular Sensor Installation System was born from a practical pain point in smart city/district/house initiatives. The client, operating under NDA, manages distributed networks of IoT sensors for smart district automation projects. Each node collects environmental/energy/goal specific data through modular sensor packages, connected via LoRa-based radio links to a centralized control layer.
The original installation workflow was slow, error-prone, and not standardized. Engineers had to pair new devices manually, configure firmware, test coverage, and upload JSON payloads — all while standing on rooftops or underground service corridors. Overall, not the quickest and pleasant experience one could imagine.
Our goal was to design a mobile-first system that could handle the full installation process in minutes — from QR-based onboarding to BLE configuration and LoRa connection tests — all within a safe, one-handed UX suited for field conditions.
The goal was to come up with both easy to use and robust solution. We had to develop logic and overall architecture of both new modular LoRa based sensor, and a way for engineers to quickly connect it to the net.
Challenges
Designing for field engineers isn’t like designing for anything else. Speed, ease of understanding and smallest amount of steps matters here more than almost anywhere else. When your engineers works on rooftops, in basements, or hanging from a harness next to a ventilation shaft, you have to throw away half of the assumptions that make “normal” UX comfortable.
This project confronted several intertwined challenges:
The first was environmental reality.
Engineers operate in unstable, harsh conditions — strong glare, gloves, wind, poor reception. Devices are often installed on uneven surfaces or in tight compartments. Each interaction has to work with minimal precision, short attention windows, and often one hand free at most.
The second challenge was network topology.
The system relied on a LoRa STAR architecture, meaning that every node communicates with a central gateway. It’s efficient in open space and on a highgrounds and allows higher throuput of data than mesh networks, but collapses in dense, obstructed areas, or underground. We had to use some kind of a fallback method — a mesh network connection layer that automatically relays data through nearby nodes when the main path fails. The UX needed to reflect that shift clearly, so technicians always know whether a device is live, meshed, or isolated.
The third was hardware modularity.
Each sensor package could be swapped or upgraded — weather, solar, energy, or air-quality — all sharing the same firmware base but different telemetry payloads. That meant the app couldn’t rely on fixed field labels or icons; it had to read module definitions dynamically, adapting to new hardware profiles without a full redesign.
And finally, there was the operational fragmentation.
Different teams used slightly different scripts, JSON schemas, and connection routines. One technician’s “installed” device might show as “unclaimed” to another. We needed a way to standardize the onboarding process — making sure that once a sensor was scanned, configured, and joined, its identity was cryptographically bound to the organization with zero manual reconciliation.
These constraints shaped everything that followed: a design that balances technical precision with bodily pragmatism, low-level radio logic with high-level clarity, and safety with autonomy.
The result had to feel like a professional instrument, not another app.
Design Approach
Design of the app
The design process began from the field, not the desk.
I spent a lot of time interviewing engineers on how they actually handled the devices. What became immediately obvious - reducing exposure time is the key to good UX in physically risky or uncomfortable positions. The UX needed to act like a tool, not a screen.
That led to three non-negotiable principles:
-
“One-hand first.” Every action — scan, connect, configure, confirm — configured to be used by one hand, operable through gloves, and legible under glare. App has to use linear, thumb-driven screens with persistent CTAs fixed at the bottom.
-
“Offline is normal.” Connectivity drops are not exceptions — they’re part of the environment. The app caches device data, queues unsent updates, and silently retries operations without interrupting the user. When connection returns, it reconciles changes automatically, with visible sync states and conflict resolution baked in.
-
“Clarity beats completeness.” Technicians need a visible, easy to see identification of device being connected and sending correct data. The UI surfaces only the actionable data: connection status, signal strength, and confirmation that the device has joined the network. Everything else — logs, diagnostics, firmware metadata — lives behind a secondary layer.
Design of the sensor.
I cannot share exact dimensions and sensor specifications outside of readily available components.
We used LoRa radio on the basis of provider-produced boards for connectivity and GPIO availability to connect buttons and the screen.
We used magnetic pins which connected to the internal M12 4-pin connector together with two claws at the top of the sensor module to keep it rigid and tight.
We also used rubber padding to insulate any sensitive parts and try to ensure IP68 compliance.
We had two-tier design process, with one person working on external look and feel, as well as placement of external connectors while keeping inside of internal volume margins, and second person designed the internals, from board and battery placement to support filament and . I was responsible for the external design process and used Fusion 360 for overall design.
Small size of the board and low energy consumption allowed us to reduce overall size of the whole device and increase the size of sensor payload case.
Parallel to the product design work, the system design evolved around the same axis.
We outsourced a lot of manual work to app service to reduce the mental workload of the engineer: it handles BLE onboarding, JSON schema validation, and fallbacks autonomously before handing control back to the LoRa layer.
Each installation follows the same choreography:
-
Scan a QR code printed on the sensor casing (contains org token + public key).
-
App establishes a short-lived BLE session and fetches device metadata (modules, firmware version, power source).
-
The user reviews or edits config fields (location, reporting interval, module selection).
-
The device joins the LoRa STAR network or switches to Meshtastic mesh if the gateway is unreachable.
-
Once connection is confirmed, the app logs an immutable record — signed and time-stamped.
In short, the system was designed around field logic, not office abstractions: quick to start, resilient to chaos, and always transparent about what’s happening. The aesthetic follows the same principle — functional, stripped-down, and readable from arm’s length, more cockpit than consumer app.
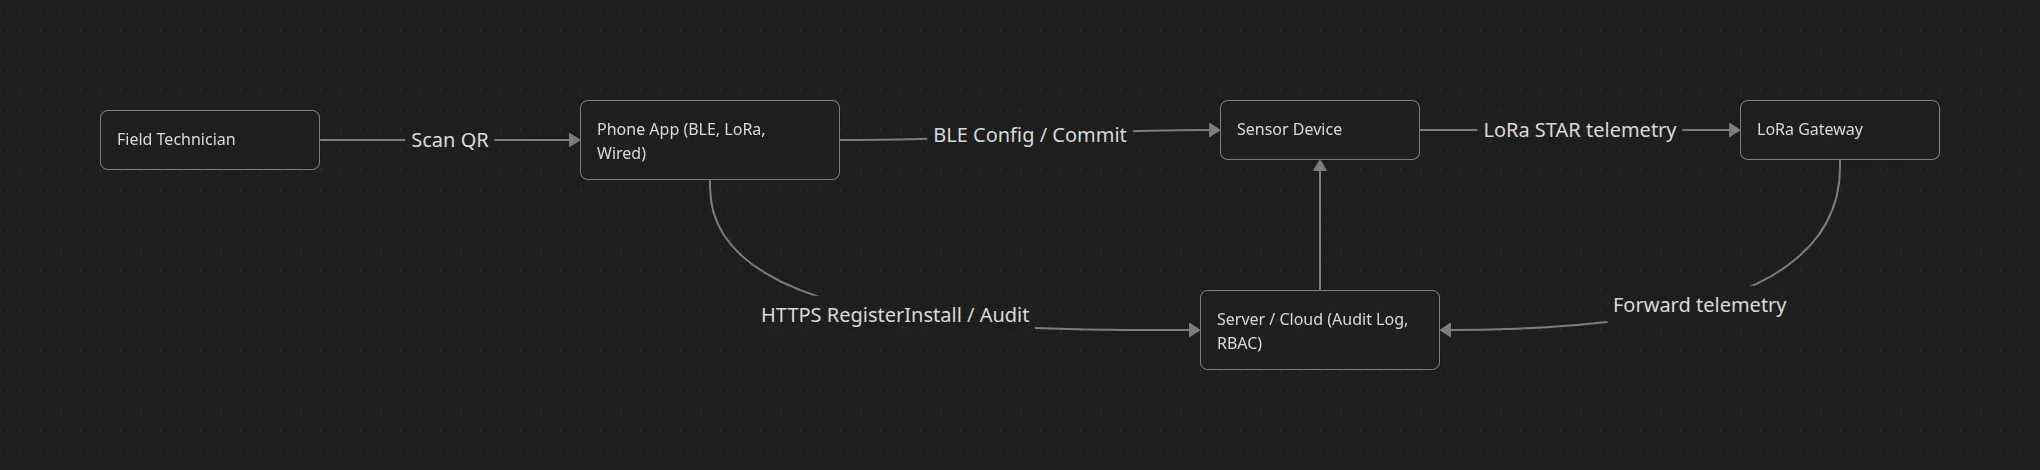
Figure 1: Complete sensor installation workflow from QR scan to network connection
System Architecture
At its core, the network uses a LoRa STAR topology: each sensor node transmits directly to a gateway, which then forwards telemetry to the cloud. It’s elegant and power-efficient, but brittle in environments where something can block
the signal.
To compensate, we built two safety nets — one software-based (Meshtastic mesh) and one hardware-based (wired fallback).
Primary Layer — LoRa STAR
Each device joins a nearby gateway using preconfigured organizational credentials. Once active, it begins sending standardized JSON telemetry packets, keeping a consistent schema regardless of module type.
The app monitors the join process in real time, displaying RSSI and SNR to help the technician physically reposition the device for a stronger link.
Fallback Layer 1 — Meshtastic Mesh
The idea to use meshtastic for communication came to me after visiting PGZ (Polska Grupa Zbrojowa) international arms exhibition in 2024 in Poland and seeing MPU-5 ad-hoc radio system. I liked the concept of mesh networks and thought that it could be useful in our enviroment. We looked for LoRa-based alternatives and found Meshtastic - open-source connection protocol for low frequency, low throughput, but high reliability and distance mesh connection protocol.
If no gateway responds within a set timeout, the device automatically enters mesh mode, using neighboring nodes as relays.
Each packet hops closer to a reachable gateway, reassembled and validated on arrival. From the user’s point of view, this process is seamless — the UI simply switches from “Direct” to “Mesh” mode, with updated connection statistics.
Fallback Layer 2 — Wired Mode
For complete radio isolation, a wired USB-C interface allows manual configuration or data extraction through the app. It’s a last resort, but essential for diagnostics and firmware recovery.
The app detects the wired link automatically and exposes a simplified setup flow — still logging the event to the same audit trail as wireless sessions.
Data consistency across these layers depends on a unified protocol. Every transmission — LoRa, mesh, or wired — follows the same JSON structure. The server interprets each packet using shared metadata: device ID, organization, module ID, power source, and timestamp. This means the data pipeline remains identical no matter how the message travels.
Security sits across all layers.
Each installation begins with QR-based onboarding: scanning a label printed on the device initializes a short-lived BLE handshake using an ephemeral key pair. The phone validates the device signature, retrieves hardware metadata, and securely pushes the configuration profile. Once the device joins the LoRa or mesh network, it switches to its persistent encryption keys managed by the organization.
From a UX standpoint, the complexity is hidden — the technician only sees a single clear outcome: Connected / Mesh / Wired. Behind that simplicity lies a distributed resilience model capable of keeping even the most remote nodes alive and synchronized.
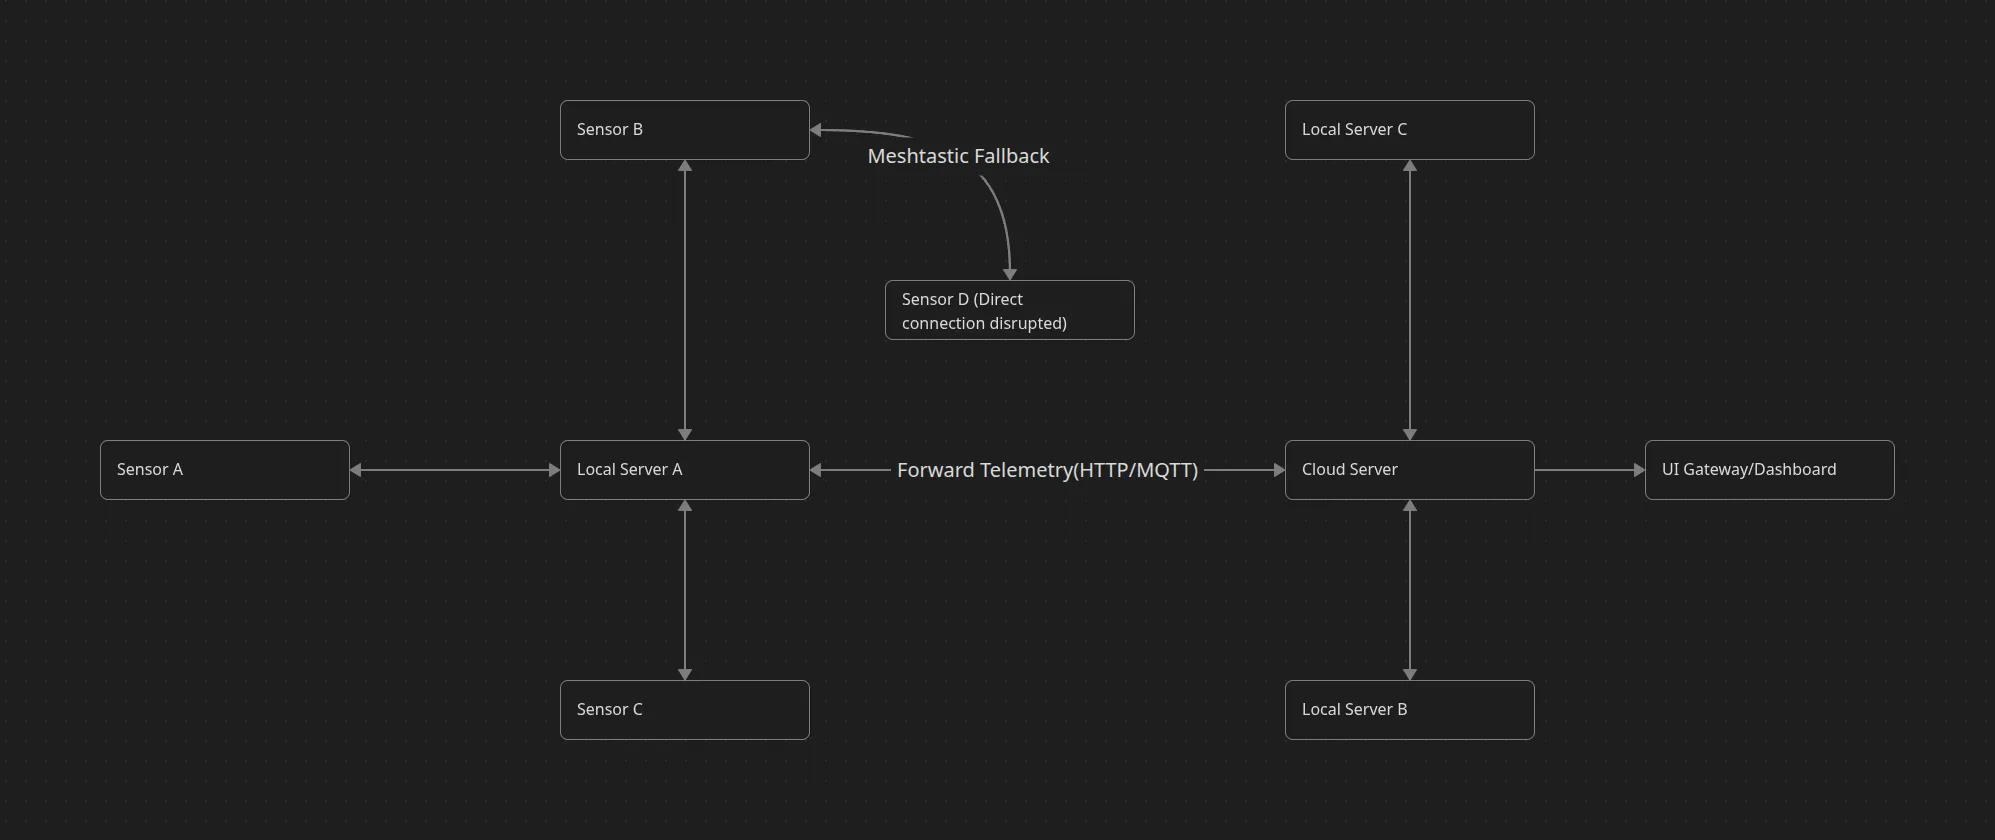
Figure 2: Network topology showing LoRa STAR architecture with Meshtastic mesh fallback and wired connectivity options
Device ↔ Phone ↔ Server ↔ Device: Connection Logic
This section explains how hardware, app, and cloud cooperate. The guiding idea: fail-safe choreography—each step is atomic, resumable, and idempotent.
1) Onboarding & Trust (QR → BLE)
Goal: bind a physical device to an organization and technician, then open a short-lived secure tunnel to push config.
Happy path (sequence):
Technician → Phone App: Scan device QR
Phone App → Device (BLE): Hello + nonce_A
Device → Phone App (BLE): HelloAck + nonce_B + dev_pub
Phone App: verify QR payload (org_token, device_id, dev_pub_hint)
Phone App: derive session key (ECDH(dev_pub, app_priv))
Phone App → Device: SessionInit {org_token, op_id, ts_signed}
Device → Phone App: SessionOK {firmware_ver, module_list, power_state}
QR payload: device_id, org_token, dev_pub_hint, manuf_sig
Session key: ephemeral ECDH; lifetime ≤ 5 min or until CommitConfig
op_id: UUID for idempotency across retries
Failure handling:
If BLE drops, app queues last outbound and auto-reconnects; device keeps session for 60 s.
If QR is stale/wrong org, app halts before any write; audit logs record attempt.
- Configuration Commit (authoritative write)
Goal: write minimal, validated config that makes the device routable.
Phone App: gather config {report_interval, modules, env_type, height, geo}
Phone App → Device (BLE): CommitConfig {op_id, config_payload, schema_ver}
Device: validate schema + persist
Device → Phone App: CommitAck {op_id, commit_hash}
Phone App → Server (HTTPS): RegisterInstall {op_id, device_id, commit_hash, geo, tech_id}
Server: verify org + store audit entry + return JoinProfile
Phone App → Device (BLE): ApplyProfile {op_id, join_profile, lora_keys}
Device → Phone App: ProfileAck {op_id}
-
Schema validation on device prevents partial writes.
-
commit_hash (HMAC over config) lets server audit exact applied state.
Failure handling:
-
If server unreachable, the RegisterInstall is queued locally with commit_hash; app still proceeds to ApplyProfile, then syncs audit when online.
-
Re-submits with same op_id are deduplicated server-side.
3) Join & Coverage (LoRa STAR → Mesh fallback)
Goal: confirm the device is live via direct LoRa; auto-fallback to mesh if needed.
Device → Gateway (LoRa): JoinReq {dev_eui, org_eui, nonce}
Gateway → Server: JoinForward
Server → Gateway: JoinAccept {session_keys, adr_policy}
Gateway → Device: JoinAccept
Device: send ProbeUplink {rssi, snr, battery, gw_seen}
Phone App ↔ Server: poll/install-status(op_id)
Server: status=DirectOK (rssi, snr, gateway_id)
If no JoinAccept within timeout T (e.g., 12 s):
Device: switch MeshMode
Device → Neighbor Nodes: MeshProbe
Neighbor → … → Gateway: Relay
Server: status=MeshOK (hops, path_quality)
Phone App: display “Mesh linked”
Technician feedback: clean labels—Connected, Mesh, or Isolated—with live RSSI/SNR.
4) Steady-State Telemetry (unified JSON)
Regardless of path (direct or mesh), packets share one schema, enabling consistent parsing and storage.
{
  "ts": 1723429320,
  "op_id": "8c7e…",
  "device_id": "NODE_1234",
  "org_id": "ORG_77",
  "link": "direct|mesh|wired",
  "power": "battery|mains|solar",
  "rssi": -104,
  "snr": 11.2,
  "module_id": "WX2",
  "payload": { "temp": 23.4, "humidity": 72 },
  "firmware": "1.3.2",
  "commit_hash": "a63f…"
}
-
op_id travels with early packets to bind telemetry to the install event.
-
commit_hash in packets lets the server confirm data came from the intended config.
5) Diagnostics & Recovery
-
Coverage test: phone triggers a ProbeUplink; server echoes RSSI/SNR and gateway_count.
-
Guidance: heuristic prompts (“rotate left”, “raise 0.5 m”) based on delta in last 2–3 probes.
-
Wired mode: if radio is fully blocked, phone opens a USB tunnel; same CommitConfig + ApplyProfile flow; a one-shot uplink is queued and sent when radio is available.
6) Security Model (summary)
-
Onboarding: QR (org binding) → BLE ECDH (ephemeral) → signed CommitConfig → server-issued LoRa keys.
-
Keys: BLE keys ephemeral; LoRa session keys rotated per policy (e.g., weekly or on firmware change).
-
RBAC: technician/supervisor/admin enforced server-side; cached offline; revalidated on sync.
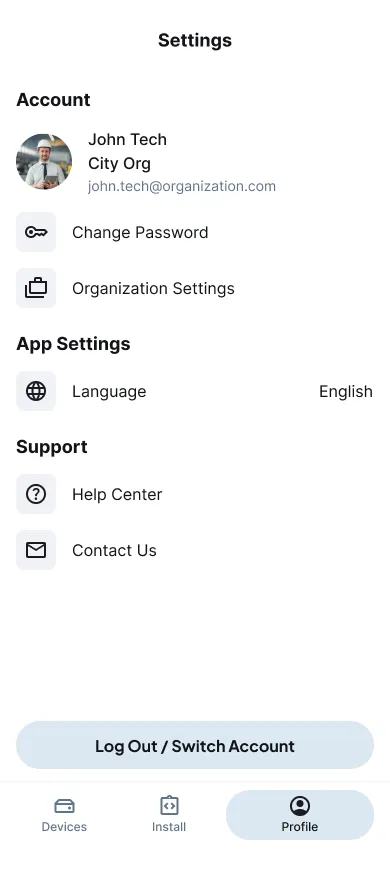
Figure 3: Technician profile interface showing role-based access control
-
Audit: every mutating action signed with device + app identity; tamper-evident chain via hash-linked entries.
-
Idempotency: op_id prevents duplicate writes/installs even after offline retries.
7) Latency & Timeout Budget (targets used in design)
-
BLE handshake: target ≤ 4 s (p95 ≤ 6 s)
-
Config commit (device write): ≤ 1.5 s
-
Register + ApplyProfile roundtrip: ≤ 2.5 s (offline tolerated)
-
Join (direct): ≤ 12 s before mesh attempt
-
Mesh relay budget: ≤ 3 hops, total ≤ 25 s to status
-
Coverage probe: ≤ 20 s end-to-end
-
Total TTA target: ≤ 3:00 in normal conditions (achieved median 2:42)
8) State Machine (install scope)
UNCLAIMED
  └─(QR scan OK)→ PAIRED_BLE
PAIRED_BLE
  └─(CommitConfig OK)→ CONFIGURED
CONFIGURED
  ├─(ApplyProfile OK)→ READY_TO_JOIN
  └─(rollback)→ PAIRED_BLE
READY_TO_JOIN
  ├─(Join direct)→ ONLINE_DIRECT
  ├─(Join mesh)  → ONLINE_MESH
  └─(wired only) → ONLINE_DEFERRED
ONLINE_*
  └─(firmware/update)→ CONFIGURED
Transitions are atomic; partial states are not exposed to the user.
Firmware Updates (OTA over BLE, Orchestrated by Server)
Pre-production introduces controlled firmware rollouts without requiring laptops. The update path uses the phone as a secure, ephemeral bridge: the server decides what to deploy and when; the app and BLE link execute the transfer atomically and resumably.
Why this is safe: updates run only after the device is cryptographically bound to the organization, checksums are verified at every hop, and the operation is idempotent (no “half-flashed” devices).
Update flow (happy path):
Server → App: UpdateAvailable {device_id, target_fw, sha256, min_battery, window}
Tech → App: “Update firmware” on Device Details
App → Server: RequestPackage {device_id, target_fw}
Server → App: ChunkManifest {N chunks, size, sha256}
App ↔ Device (BLE): UpdateInit {op_id, target_fw, sha256}
App → Device (BLE): stream chunks [1..N] with per-chunk HMAC
Device: verify each chunk, write to staging partition
Device → App: StageComplete {op_id, staged_sha256}
App → Device: Commit {op_id}
Device: reboot to staging, self-verify, swap partitions, boot new
Device → App: PostBoot {op_id, new_fw, health=OK}
App → Server: ConfirmUpdate {op_id, device_id, new_fw, diag}
Resilience & guardrails:
-
Power safety: updates require minimum battery threshold or mains power; the app blocks the action otherwise.
-
Chunked transfer with resume: if BLE drops, the device keeps verified chunks; the app resumes from the last good index (no restarts).
-
Dual-partition rollback: the device stages to an alternate partition; if post-boot health checks fail, it auto-rolls back and reports the failure code.
-
Time windows: rollouts can be constrained (e.g., nights/weekends) to avoid peak telemetry windows; the app enforces windows locally when offline.
-
Policy gates: supervisors can pin devices to “defer updates” if a site is in a freeze period.
Security model:
-
Signed artifacts: firmware images are signed server-side; the app verifies signatures before the first chunk is sent.
-
Per-chunk integrity: HMAC on each chunk prevents bit-flip or injection during BLE transit.
-
RBAC + audit: only technicians/supervisors with the “Update” role can initiate; every stage emits a tamper-evident audit entry (init, stage, commit, post-boot).
Metrics we’ll track at rollout:
-
Update success rate (first-attempt and with resume), average staging/commit times by model
-
Post-update stability (unexpected reboots, radio attach success within 60s)
-
Correlation between firmware cohort and mesh fallback usage
-
Mean time between updates and impact on battery life
Failure paths (summarized):
-
Checksum mismatch: halt, discard staging, re-request manifest.
-
Battery below threshold: block start; suggest connecting to mains or deferring.
-
Post-boot health fail: auto-rollback; create a “needs inspection” ticket with logs attached.
With this design, OTA becomes a controlled, low-risk operation that technicians can run confidently on-site, and ops can monitor centrally without brittle spreadsheets or ad-hoc CLI scripts.
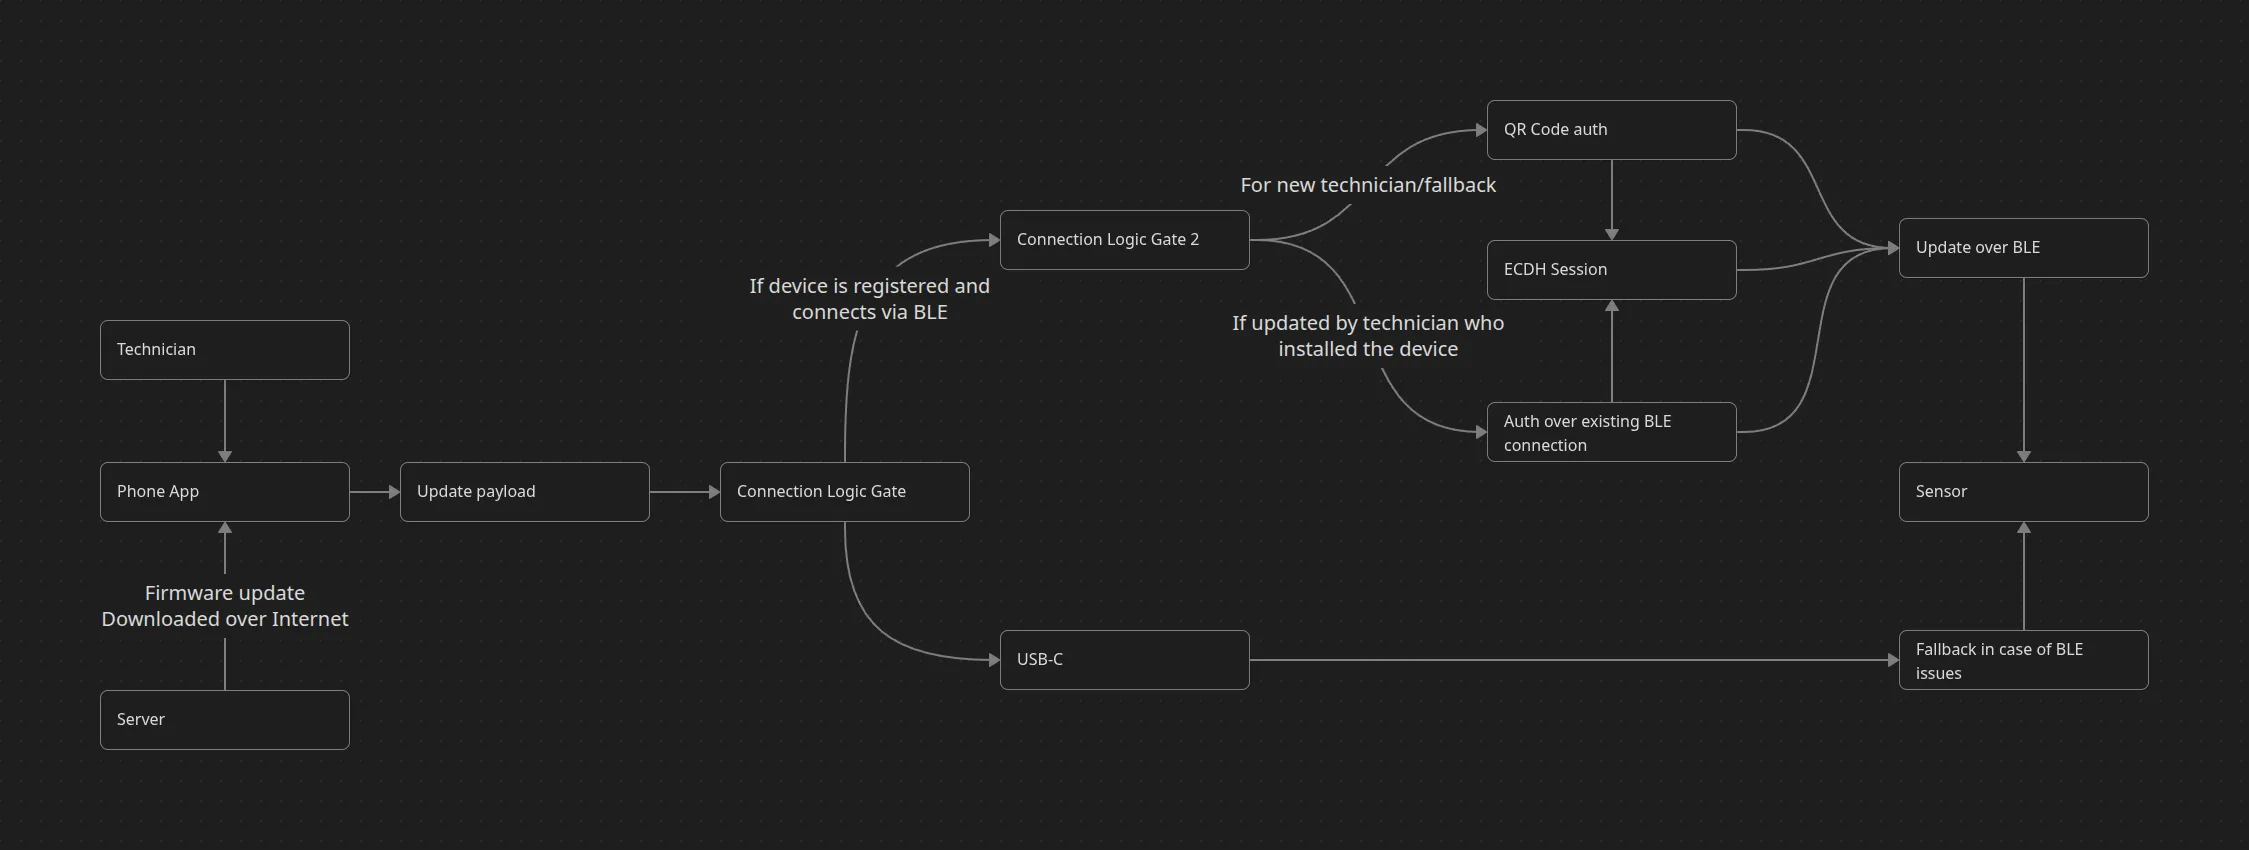
Figure 4: Over-the-air update process showing chunked transfer with verification
UI & UX Design
The interface was designed as a field instrument, not a mobile app in the conventional sense. It’s a tool you can trust when you’re hanging off a ladder, working in glare, or with one gloved hand free.
The app’s structure follows a simple logic:
Devices → Install → Diagnostics.
Three sections that cover the entire lifecycle of a sensor, each with its own rhythm of interaction but unified through consistent visual and interaction patterns.
Devices Overview
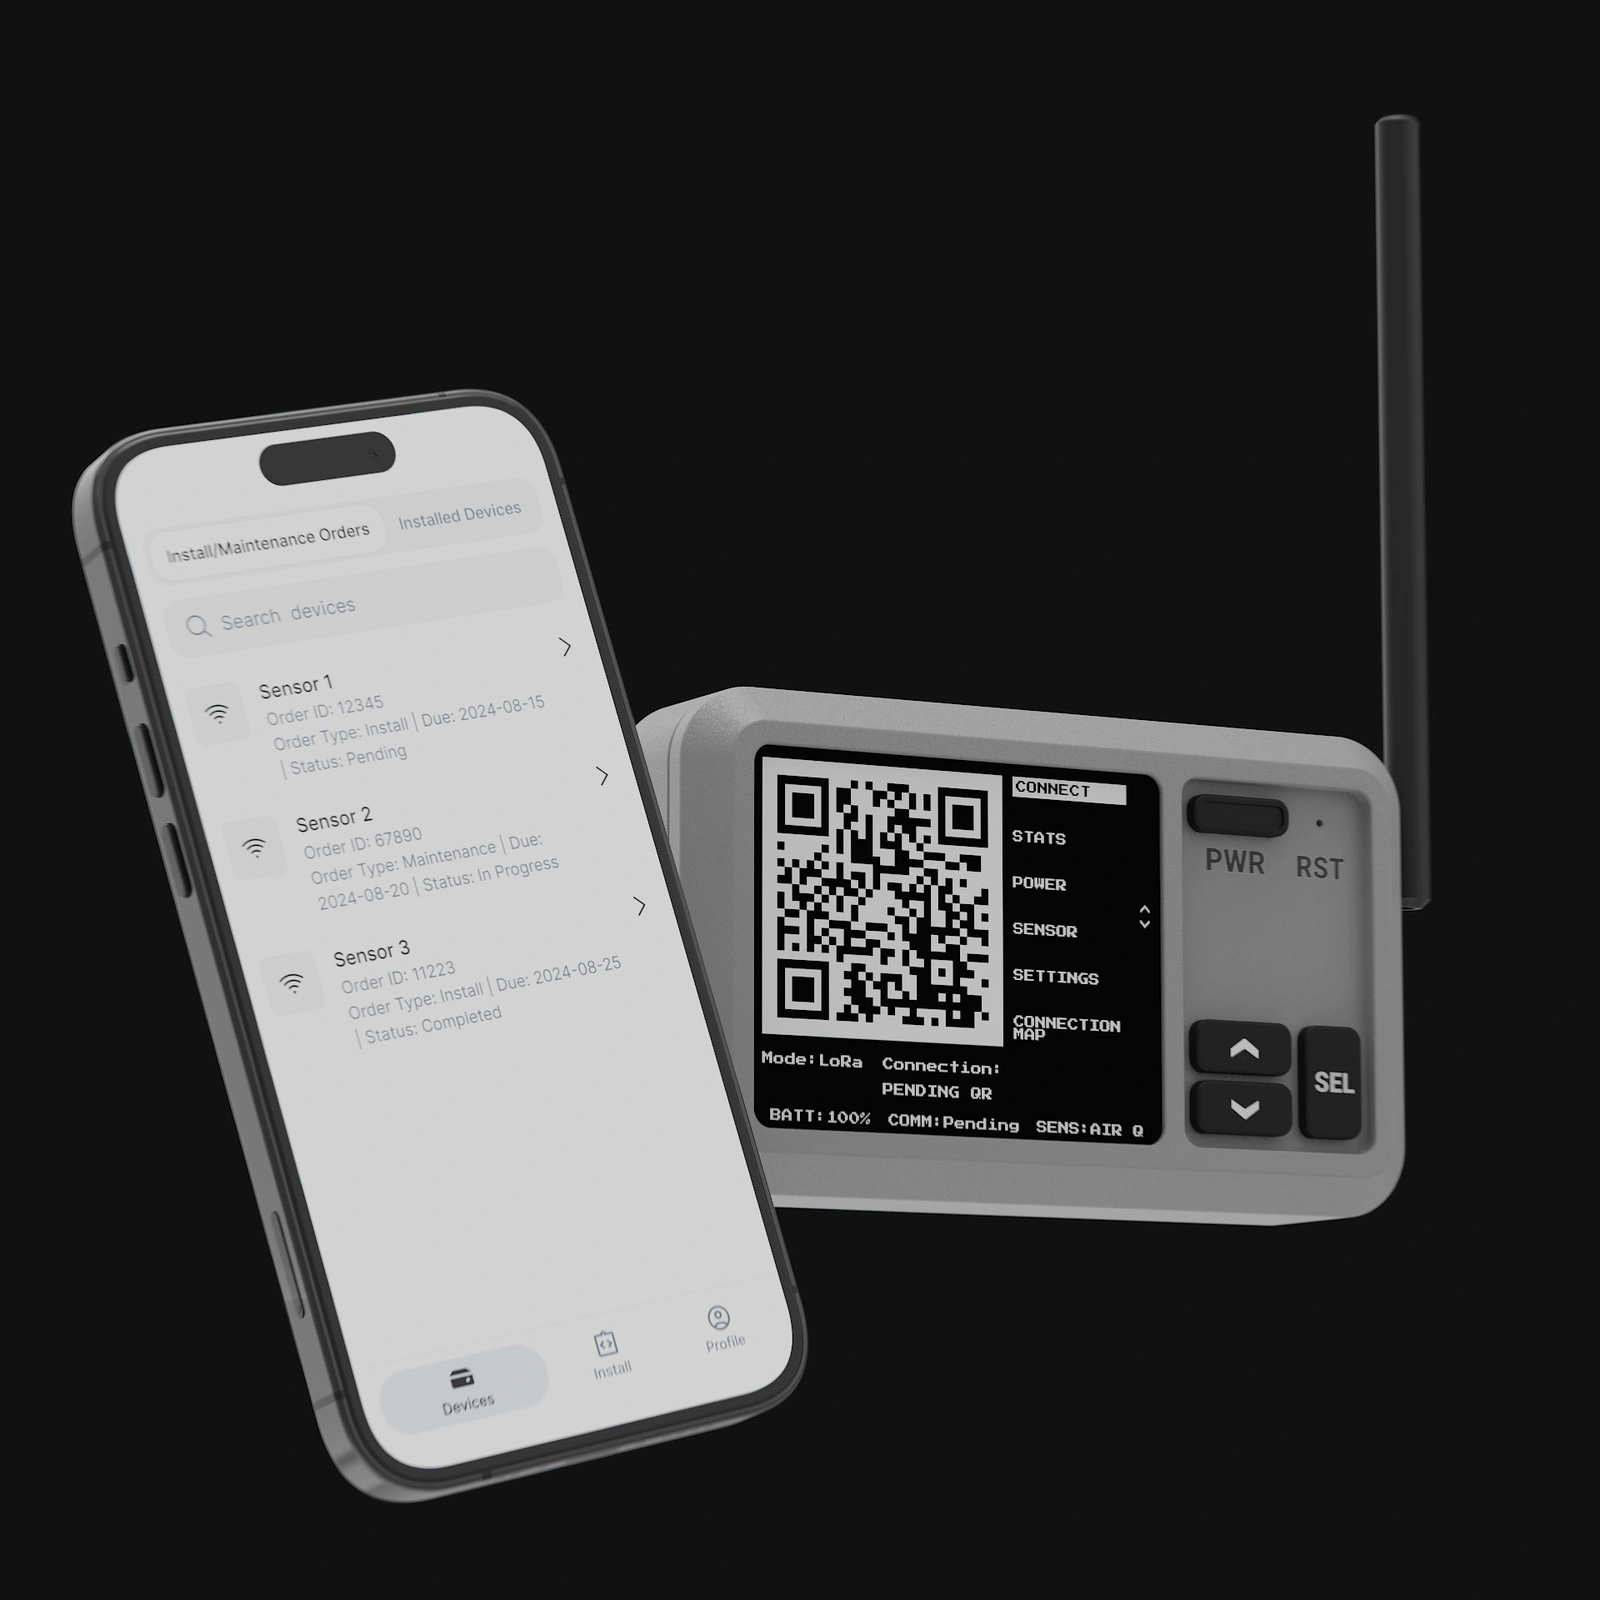
The first screen, Devices, acts as the system’s anchor. It’s both a mission list and a heartbeat monitor.
At a glance, technicians can see which sensors are pending installation, which are active, and which need service. The layout prioritizes status visibility over density: large colored badges (green for online, yellow for weak link, red for offline), clean typography, and minimal text.
Each card exposes just enough information to make a decision — sensor ID, power source, last connection, assigned technician — while deferring advanced details to the next screen. Search and filtering work instantly, supporting offline queries through cached datasets, so engineers can prepare in advance without needing live connectivity.
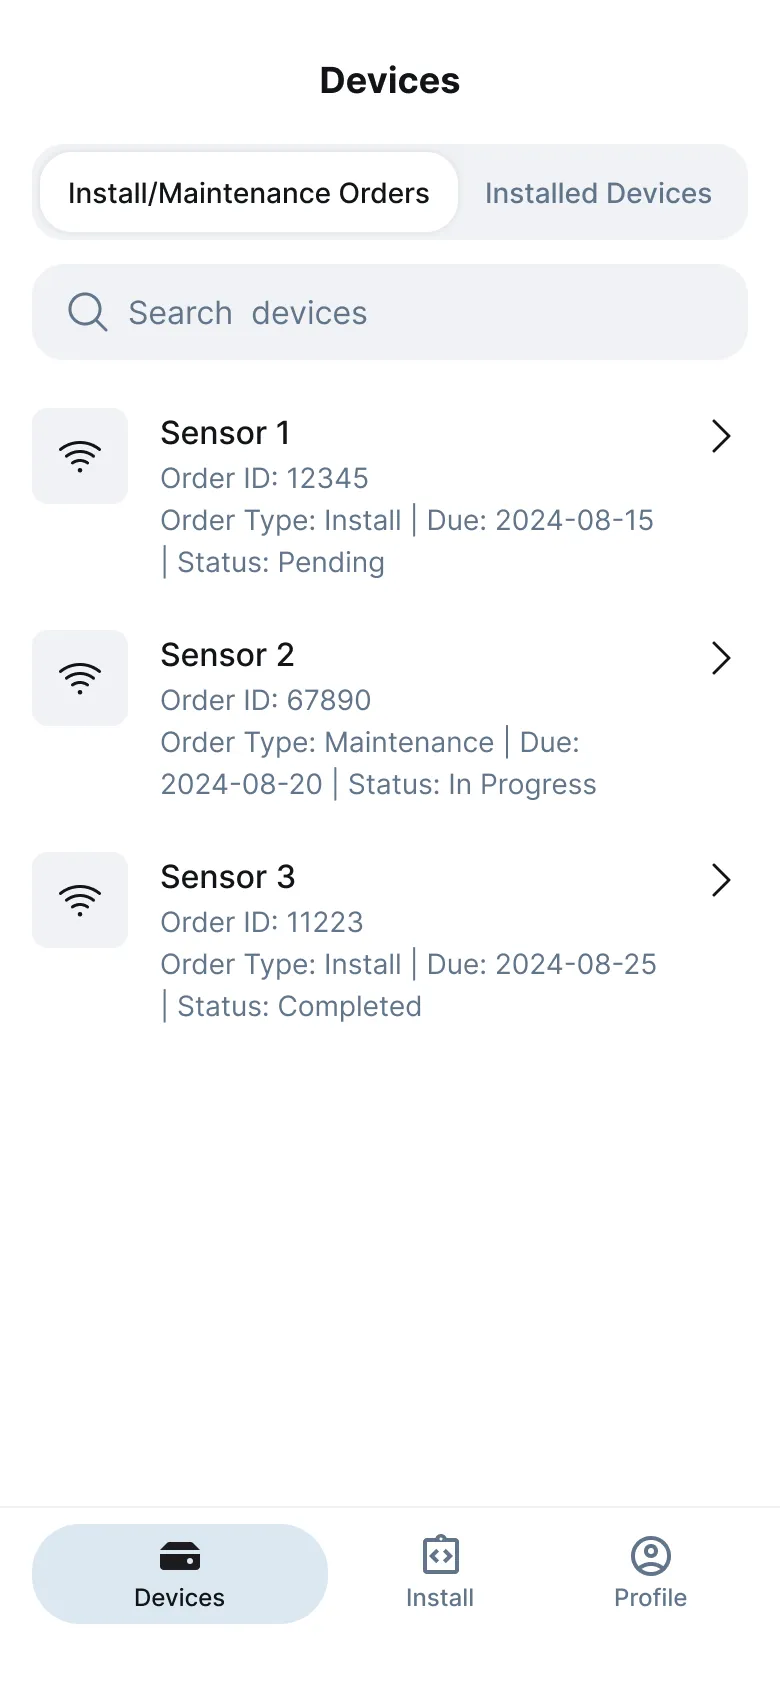
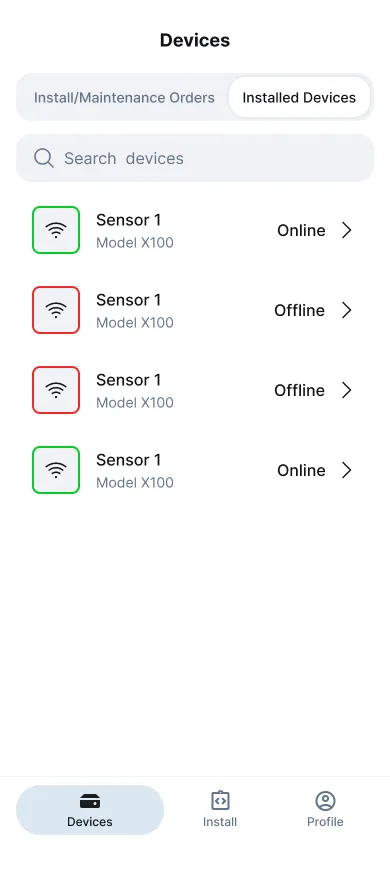
Figure 5: Main interface showing pending installations (left) and active sensors (right)
Device Details
Opening a device reveals its full diagnostic context.
This view consolidates firmware version, signal quality, battery level, uptime, and a map of its physical location. Unlike many technical dashboards that overwhelm with metrics, this one speaks the language of the field: green if stable, orange if uncertain, red if disconnected.
Contextual actions — Update Settings, View Live Data, Run Coverage Test — live in a compact bottom sheet, accessible by thumb.
Each transition between views uses gentle motion feedback — not as decoration, but as orientation; the interface moves in the same direction the user’s attention flows (downward during setup, upward when reviewing).
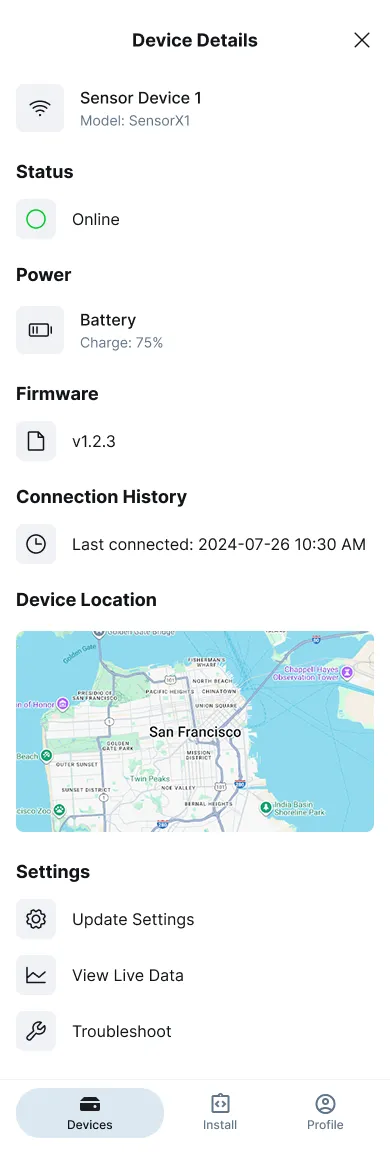
Figure 6: Comprehensive device diagnostics showing signal quality, battery status, and location
Installation Flow
The Install section is the centerpiece of the experience — the moment when physical hardware becomes part of the network.
It starts with a simple gesture: scanning a QR code etched on the device casing. That scan immediately initiates a secure BLE handshake, validating the device’s identity and pulling its metadata — firmware version, available modules, and power source.
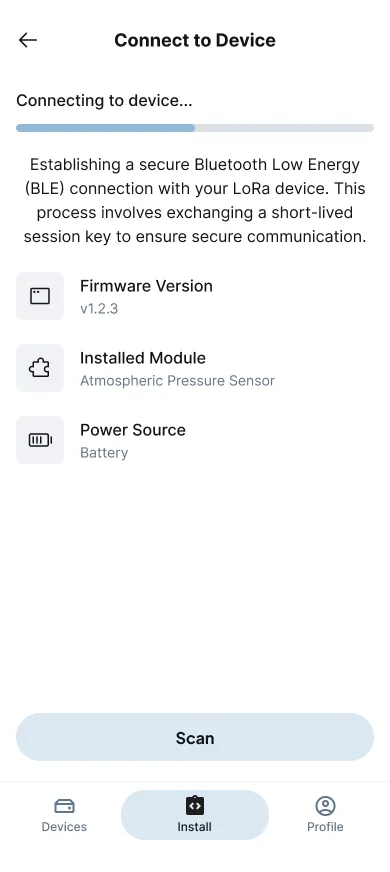
Figure 7: QR code scanning interface for secure device onboarding
The configuration flow that follows is linear and calm.
No tab switching, no scrolling through dense forms — just a sequence of full-screen steps:
-
Confirm or adjust reporting interval.
-
Choose active sensor modules.
-
Specify Installation height and environment type (roof, wall, underground).
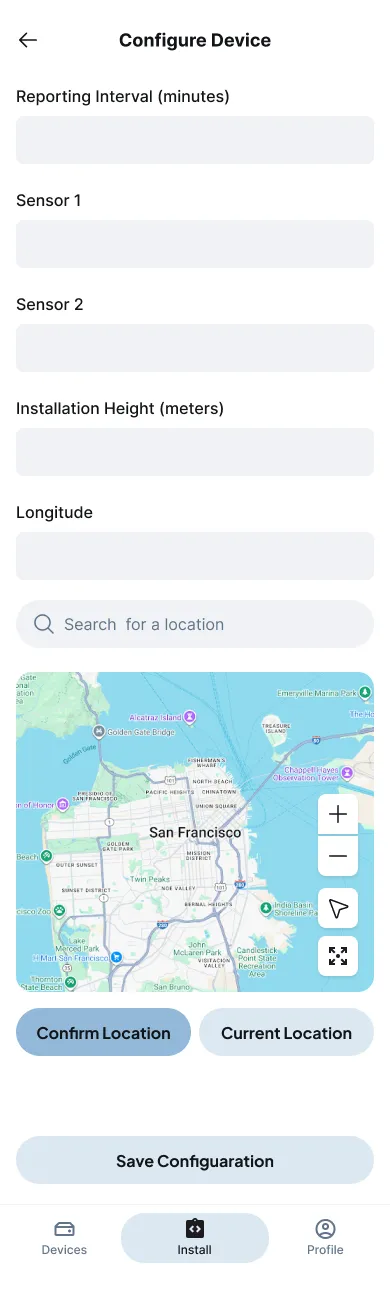
Figure 8: Manual configuration options for advanced sensor module setup
- Confirm location, either manually or via “Current Location” using GPS.
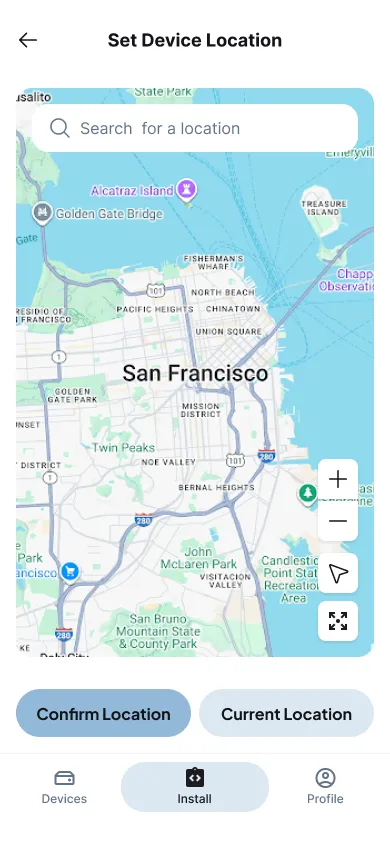
Figure 9: Location confirmation interface with oversized controls for gloved hands
Location confirmation opens a Mapbox map with oversized controls and instant feedback. The engineer taps once, sees the coordinates snap into place, and moves on. The entire process can be done with a thumb, and the UI never assumes two-hand precision.
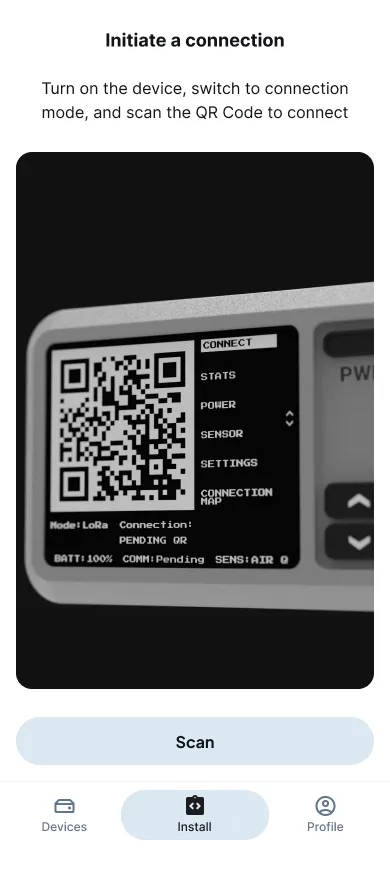
Figure 10: Linear configuration flow designed for one-handed operation in field conditions
Coverage & Diagnostics
Before locking the device in place, the app runs a coverage test — a single uplink packet sent through LoRa.
If the gateway response is strong, the app displays signal bars and SNR values; if not, it offers guidance like “Try repositioning the device 20° left” or “Move closer to the edge.”
It’s immediate, visual, and repeatable — no logs, no jargon, just a binary “good enough to trust” signal.
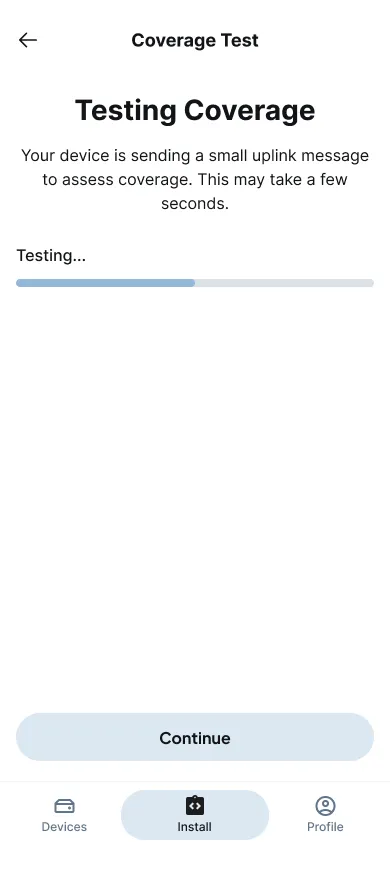
Figure 11: Signal strength testing interface with visual feedback and positioning guidance
The Diagnostics panel retains the last join attempt, showing historical signal data, gateway count, and power trends. This helps supervisors audit performance remotely and reduces the need for repeat site visits.
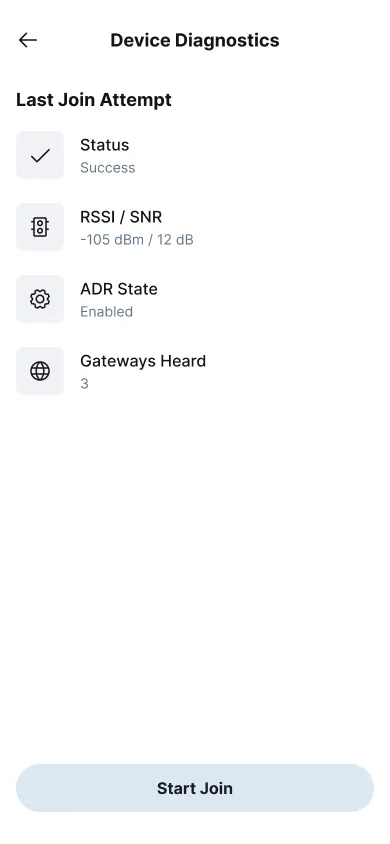
Figure 12: Diagnostic panel showing historical signal data and connection trends
Validation and field testing
After several months of iterative design, the system was deployed for pilot testing across three Smart City microdistricts under NDA.
The sites covered a deliberately diverse range of conditions — rooftop solar arrays, semi-underground service corridors, and mid-rise facades — to stress-test the system’s reliability under variable radio and environmental constraints.
Each pilot involved six field engineers working with 18 modular sensors configured across two firmware profiles.
Every installation was timed, observed, and logged with the same rigor used in aviation or industrial commissioning: from the moment of QR scan to confirmed network join.
The aim wasn’t just to measure speed, but to assess how much mental effort and uncertainty the new UX removed from the process.
The results were decisive.
Average Time-to-Attach (TTA) — the time it takes for a device to go from “boxed” to “live in the network” — dropped from 7 minutes 10 seconds (legacy laptop + CLI flow) to a median of 2 minutes 42 seconds.
Even more revealing was the interquartile range: what used to swing wildly between 5 and 12 minutes became a tight, predictable band under 1 minute of variance.
The first-attempt success rate rose to 83%, with an additional 12% of successful joins achieved automatically via mesh fallback — meaning almost every installation completed without a retry.
Configuration errors, previously caused by installer software variance, fell by 58%, thanks to QR-based validation and in-app auto-checks.
But speed and accuracy were only part of the story.
NASA-TLX: What the Scores Mean and Why They Matter
The NASA-Task Load Index (NASA-TLX) measures how demanding a task feels — not how fast it’s done, but how much mental and physical effort it takes.
Each participant rates six factors on a 0–100 scale (lower is better).
It’s a standard metric used in aviation and mission-critical UX testing to quantify cognitive load.
The six dimensions
-
Mental Demand – how much concentration and decision-making the task requires
-
Physical Demand – the level of physical activity or dexterity involved
-
Temporal Demand – how rushed or time-pressured the user feels
-
Performance (inverse) – how successful they felt they were at completing the task
-
Effort – how hard they had to work to achieve the result
-
Frustration – stress, irritation, or uncertainty during the task
Results at a glance
Average overall workload dropped from 52/100 → 31/100, a ~40 % reduction in perceived effort.
That change moves the process from “tedious and mentally noisy” to “predictable and manageable.”
Dimension-level changes
-
Mental Demand: 55 → 36 (−35 %)
-
Physical Demand: 28 → 24 (−14 %)
-
Temporal Demand: 65 → 35 (−46 %)
-
Performance (inv.): 48 → 30 (−38 %)
-
Effort: 59 → 35 (−41 %)
-
Frustration: 60 → 28 (−53 %)
Composite (RAW-TLX): 52 → 31 (−40 %)
How to interpret this
A 20-point or greater drop on NASA-TLX represents a qualitative improvement, not a rounding error.
It means users no longer feel rushed, uncertain, or over-stressed.
Practically, that translates to:
-
Fewer configuration errors (−58 %)
-
More consistent install times (IQR compressed to under one minute)
-
Lower fatigue and safer working posture in field environments
-
Shorter onboarding and training curve for new technicians
What drove the reduction
-
QR → BLE onboarding eliminated manual ID entry and schema mismatches.
-
Linear, thumb-first flow reduced scrolling and cognitive switching.
-
Coverage-test guidance replaced radio jargon with actionable feedback (“rotate left”, “good link”).
-
Offline queue + auto-resume removed anxiety about losing progress mid-install.
-
Clear connection states (Direct / Mesh / Isolated) replaced ambiguity with certainty.
Operationally, the downstream effects were significant.
Repeat site visits dropped by 31%, since diagnostics could be run directly from the field without re-scripting connections.
Supervisors gained real-time visibility into install progress, and audit logs allowed them to trace exactly who configured what and when — eliminating the usual email chain of blame when something went wrong.
Lessons Learned
Building for field engineers rewires your sense of “good UX.” The right outcome isn’t just fewer taps—it’s less exposure time in risky contexts and fewer unknowns during radio-fragile moments. Three insights shaped the product:
1) Treat “offline” as the norm, not the edge.
Designing the app as a transaction queue (atomic ops, idempotent op_id, visible sync states) removed the fear of partial installs. Technicians stopped second-guessing whether the device was “really” onboarded, because the system simply wouldn’t allow an ambiguous state.
2) Security must be invisible and deterministic.
QR→BLE onboarding with ephemeral keys, followed by org-issued LoRa credentials, gave us two truths at once: no credential juggling in the field, and audit-grade traceability in the back office. The key lesson: cryptography that the user never “feels” is still doing the heavy lifting.
3) Fallbacks are a UX feature, not just an RF feature.
Mesh routing and wired mode aren’t “nice to have”—they’re how the UI earns trust. The moment the app cleanly says Direct / Mesh / Isolated, frustration collapses. Users don’t need RF theory; they need an answer and a next step.
4) Modularity only works with a modular data contract.
Standardizing LoRa JSON (shared core fields + module payloads) avoided per-module UI forks. The UI adapts from metadata, not hard-coded flows—critical when hardware evolves faster than software sprints.
5) Ergonomics > ornament.
Big targets, persistent bottom CTAs, sunlight-legible contrasts, and motion used for orientation (not flair) mattered more than any visual flourish. When a hand is on a harness, “thumb-reachable” is a safety requirement, not a taste choice.
Limitations & Open Questions
-
RF path planning is reactive, not predictive.
We verify coverage in situ; we don’t yet predict it from building materials, elevation models, or prior heatmaps. -
Mesh policy is conservative.
Current default caps hops (~3) to keep latency predictable; dense urban can justify dynamic budgets. -
Diagnostics are single-device first.
Fleet-level anomaly detection (e.g., sudden SNR collapse across a block) is planned but not shipped. -
Firmware/OTA scope is minimal.
BLE OTA is on the roadmap; today we focus on install/config and validation.
Risk & Mitigation
-
Manufacturing variance (RF performance, battery).
Mitigation: on-receipt QA checklist; auto-attach burn-in with probe uplinks; flagging weak units before field issue. -
Clock skew impacting audit chains.
Mitigation: signed local timestamps plus server receipt time; tolerance window ±90s; periodic time sync prompts. -
Operator protocol drift between crews. Mitigation: embedded checklists in the flow, photo hints for mounting best practices, and mandatory coverage probe before “Done.”
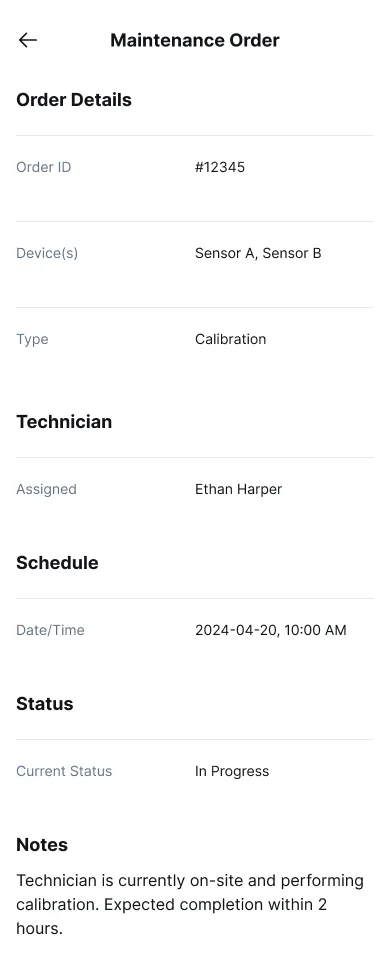
Figure 13: Maintenance order interface for tracking service and inspection requirements
Pre-Production Status & Rollout
The system is currently in pre-production validation, awaiting sensor manufacturing and full-scale deployment.
The pilot phase served as a controlled proof-of-concept, validating both the technical architecture and the field UX under realistic conditions.
After rollout we’ll collect longitudinal data on:
-
installation velocity (TTA and variance by site type),
-
mesh fallback usage and hop profiles,
-
long-term reliability (first-join success over months, repeat-visit rate, battery/firmware stability).
These metrics will inform mesh policy tuning, OTA cadence, and gateway placement—closing the loop between radio engineering, UX behavior, and operational economics.